レイヤの処理
スタイルにはレイヤーを使用して、データの特定のサブセットにスタイリング規則を追加する。(例えば、マップ上のあらゆる川をピンクにすれば、スタイルには該当なレイヤーを作成する)。レイヤーには、スタイルを定義しているデータへの参照および適用されるスタイリング規則の両方がある。

Web
スタイルのレイヤプロパティは、利用可能な全てのレイヤーをリストする。 レイヤーのタイプは「type」のプロパティで指定され、背景、塗りつぶし、線、シンボル、ラスター、円、塗りつぶし押し出し、ヒートマップ、陰影起伏のいずれかでなければならない。
背景タイプのレイヤ以外、他のレイヤがソースに参照する必要である。レイヤはソースから取得されたデータを使用し、任意でフィーチャを絞込み、その後、それらのフィーチャのスタイル設定方法を定義する。
例
備考: 方向APIに関して、詳しくは下記のドキュメントをご参考くださいhttps://docs.mapbox.com/api/navigation/#directions
例
1. <!DOCTYPE html>
2. <html>
3. <head>
4. <meta charset='utf-8' />
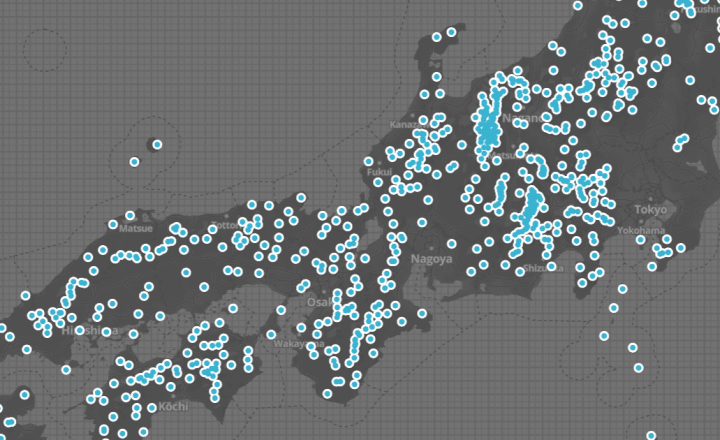
5. <title>Create a heatmap layer</title>
6. <meta name='viewport' content='initial-scale=1,maximum-scale=1,user-scalable=no' />
7. <script src='https://api.tiles.mapbox.com/mapbox-gl-js/v1.1.1/mapbox-gl.js'></script>
8. <link href='https://api.tiles.mapbox.com/mapbox-gl-js/v1.1.1/mapbox-gl.css' rel='stylesheet' />
9. <style>
10. body { margin:0; padding:0; }
11. #map { position:absolute; top:0; bottom:0; width:100%; }
12. </style>
13. </head>
14. <body>
15.
16.
17. <div id='map'></div>
18.
19. <script>
20. mapboxgl.accessToken = 'pk.YOUR_TOKEN';
21. var map = new mapboxgl.Map({
22. container: 'map',
23. style: 'mapbox://styles/mapbox/dark-v10',
24. center: [139.766357, 35.681461],
25. zoom: 2
26. });
27.
28. map.on('load', function() {
29. // Add a geojson point source.
30. // Heatmap layers also work with a vector tile source.
31. map.addSource('earthquakes', {
32. "type": "geojson",
33. "data": "https://docs.mapbox.com/mapbox-gl-js/assets/earthquakes.geojson"
34. });
35.
36. map.addLayer({
37. "id": "earthquakes-heat",
38. "type": "heatmap",
39. "source": "earthquakes",
40. "maxzoom": 9,
41. "paint": {
42. // Increase the heatmap weight based on frequency and property magnitude
43. "heatmap-weight": [
44. "interpolate",
45. ["linear"],
46. ["get", "mag"],
47. 0, 0,
48. 6, 1
49. ],
50. // Increase the heatmap color weight weight by zoom level
51. // heatmap-intensity is a multiplier on top of heatmap-weight
52. "heatmap-intensity": [
53. "interpolate",
54. ["linear"],
55. ["zoom"],
56. 0, 1,
57. 9, 3
58. ],
59. // Color ramp for heatmap. Domain is 0 (low) to 1 (high).
60. // Begin color ramp at 0-stop with a 0-transparancy color
61. // to create a blur-like effect.
62. "heatmap-color": [
63. "interpolate",
64. ["linear"],
65. ["heatmap-density"],
66. 0, "rgba(33,102,172,0)",
67. 0.2, "rgb(103,169,207)",
68. 0.4, "rgb(209,229,240)",
69. 0.6, "rgb(253,219,199)",
70. 0.8, "rgb(239,138,98)",
71. 1, "rgb(178,24,43)"
72. ],
73. // Adjust the heatmap radius by zoom level
74. "heatmap-radius": [
75. "interpolate",
76. ["linear"],
77. ["zoom"],
78. 0, 2,
79. 9, 20
80. ],
81. // Transition from heatmap to circle layer by zoom level
82. "heatmap-opacity": [
83. "interpolate",
84. ["linear"],
85. ["zoom"],
86. 7, 1,
87. 9, 0
88. ],
89. }
90. }, 'waterway-label');
91.
92. map.addLayer({
93. "id": "earthquakes-point",
94. "type": "circle",
95. "source": "earthquakes",
96. "minzoom": 7,
97. "paint": {
98. // Size circle radius by earthquake magnitude and zoom level
99. "circle-radius": [
100. "interpolate",
101. ["linear"],
102. ["zoom"],
103. 7, [
104. "interpolate",
105. ["linear"],
106. ["get", "mag"],
107. 1, 1,
108. 6, 4
109. ],
110. 16, [
111. "interpolate",
112. ["linear"],
113. ["get", "mag"],
114. 1, 5,
115. 6, 50
116. ]
117. ],
118. // Color circle by earthquake magnitude
119. "circle-color": [
120. "interpolate",
121. ["linear"],
122. ["get", "mag"],
123. 1, "rgba(33,102,172,0)",
124. 2, "rgb(103,169,207)",
125. 3, "rgb(209,229,240)",
126. 4, "rgb(253,219,199)",
127. 5, "rgb(239,138,98)",
128. 6, "rgb(178,24,43)"
129. ],
130. "circle-stroke-color": "white",
131. "circle-stroke-width": 1,
132. // Transition from heatmap to circle layer by zoom level
133. "circle-opacity": [
134. "interpolate",
135. ["linear"],
136. ["zoom"],
137. 7, 0,
138. 8, 1
139. ]
140. }
141. }, 'waterway-label');
142. });
143. </script>
144.
145. </body>
146. </html>